Scientific Visualization Made Simple
Visualize CFD simulations, 3D meshes, and scientific data with professional-grade tools directly in your browser. Store your simulations in the cloud, access them anywhere, and share with your team.
Visualize CFD simulations, 3D meshes, and scientific data with professional-grade tools directly in your browser. Store your simulations in the cloud, access them anywhere, and share with your team.
Everything you need to analyze and present your simulation results
Load OpenFOAM cases and ANSYS Fluent data directly. Browse cases, select time steps, and visualize fields with ease.
Jet, Viridis, Plasma, Cool-to-Warm, and more. Professional colormaps for scientific visualization.
Contours, slices, streamlines, vectors, thresholds, and glyphs. Complete professional filter pipeline.
Visualize velocity, pressure, temperature, and custom scalar/vector fields.
Rotate, zoom, pan with smooth WebGL-powered 3D rendering. Export screenshots and views.
Store your simulations securely in the cloud. Access your data from anywhere, anytime, on any device.
Take control of collaborator sessions for guided walkthroughs and real-time collaborative analysis.
Call your team directly within the platform. Discuss results in real-time while visualizing together.
Capture high-quality screenshots of your visualizations for publications, presentations, and reports.
Professional visualization tools for your CFD simulations
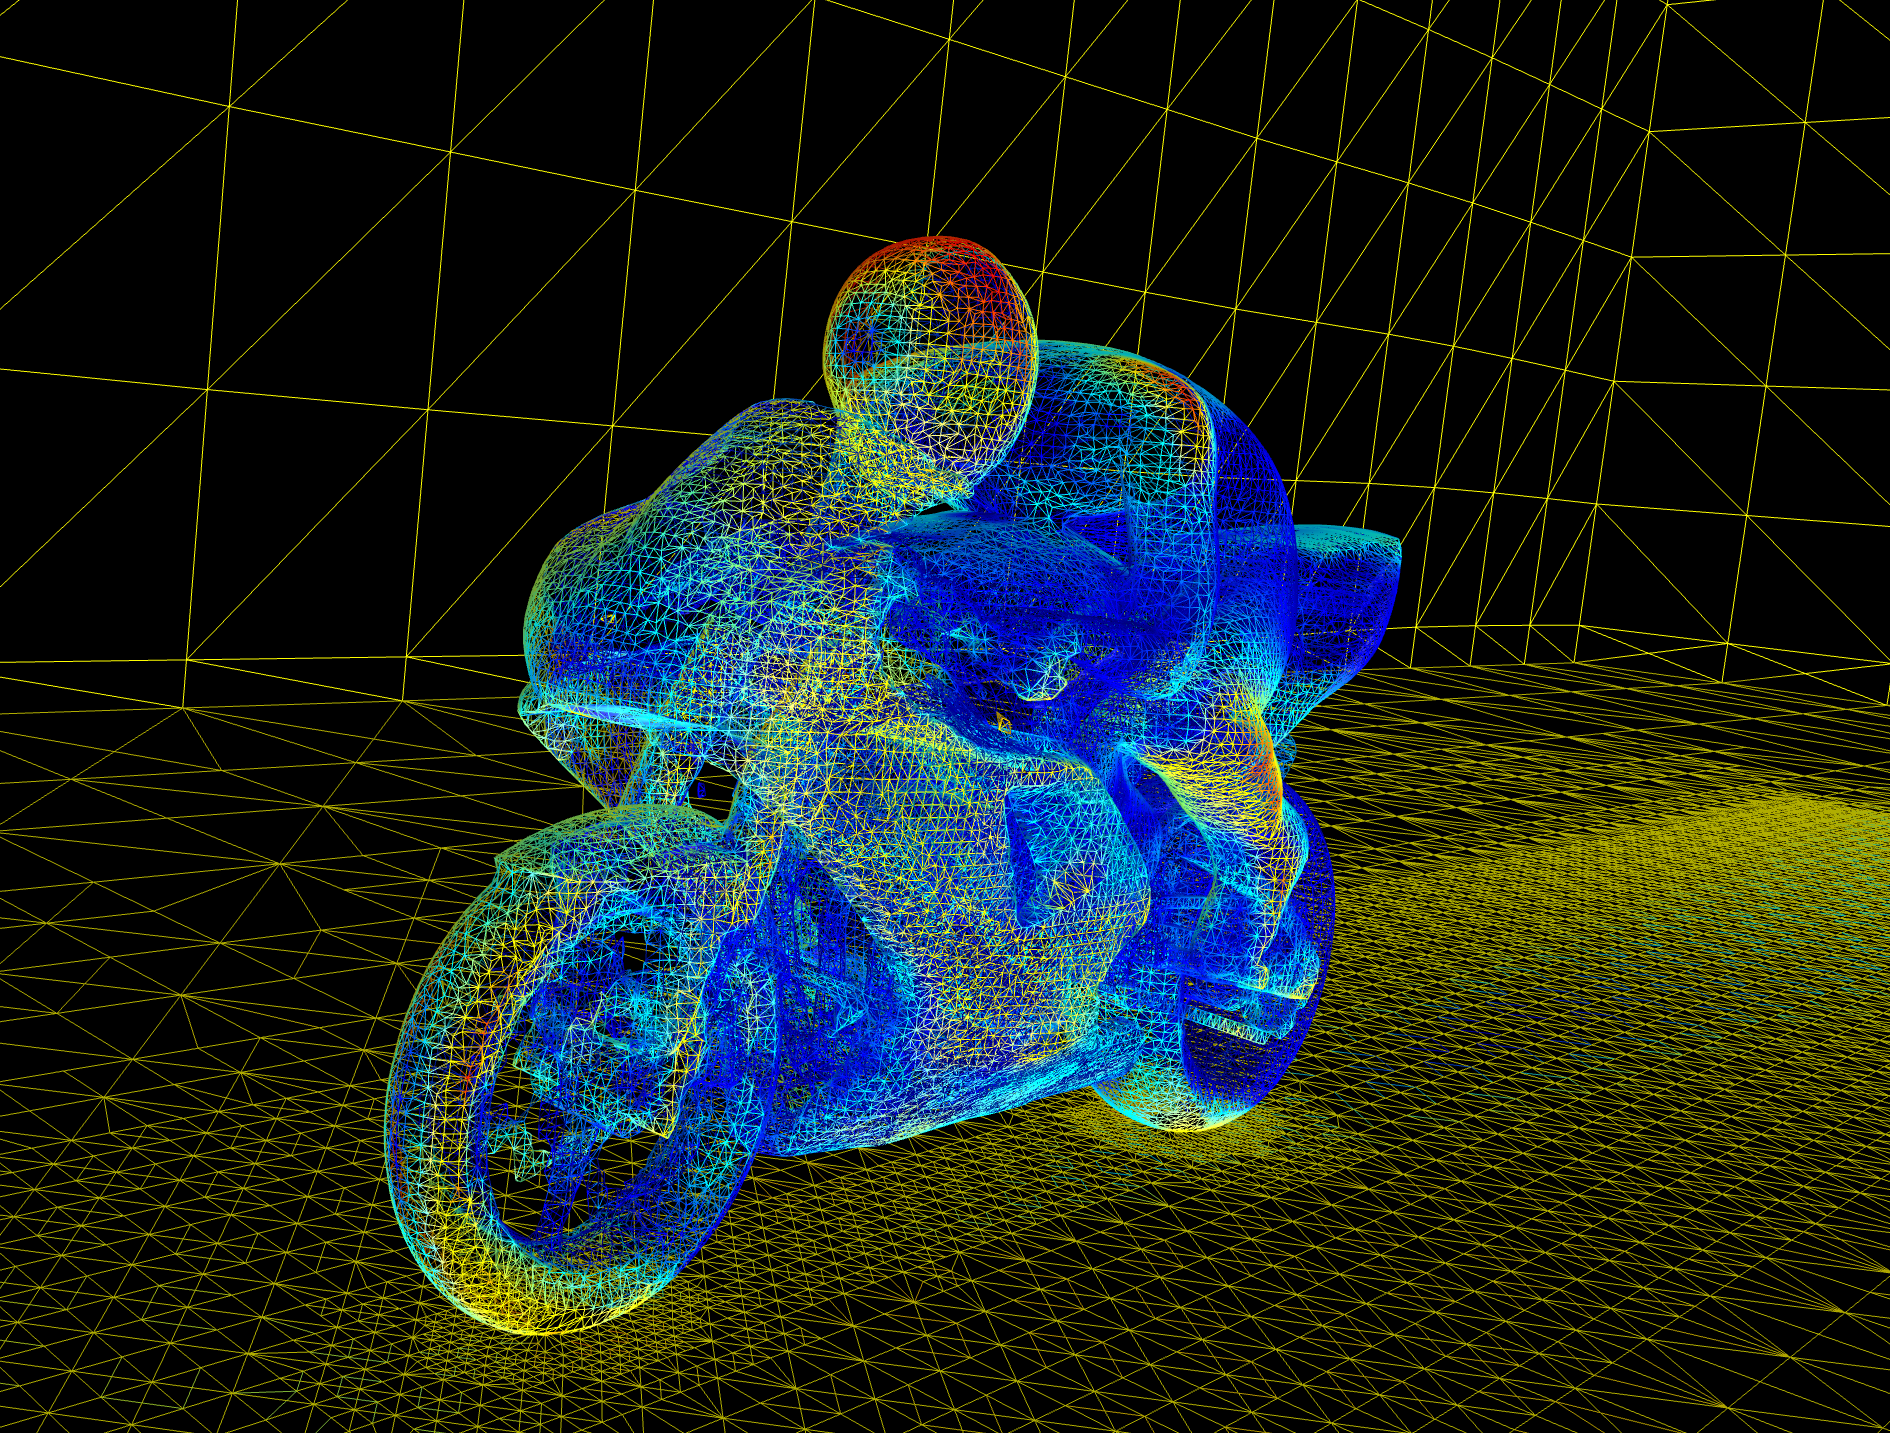
Load your CFD simulations and explore them in a modern, browser-based 3D viewer. Navigate with smooth controls, select time steps, and switch between fields instantly.
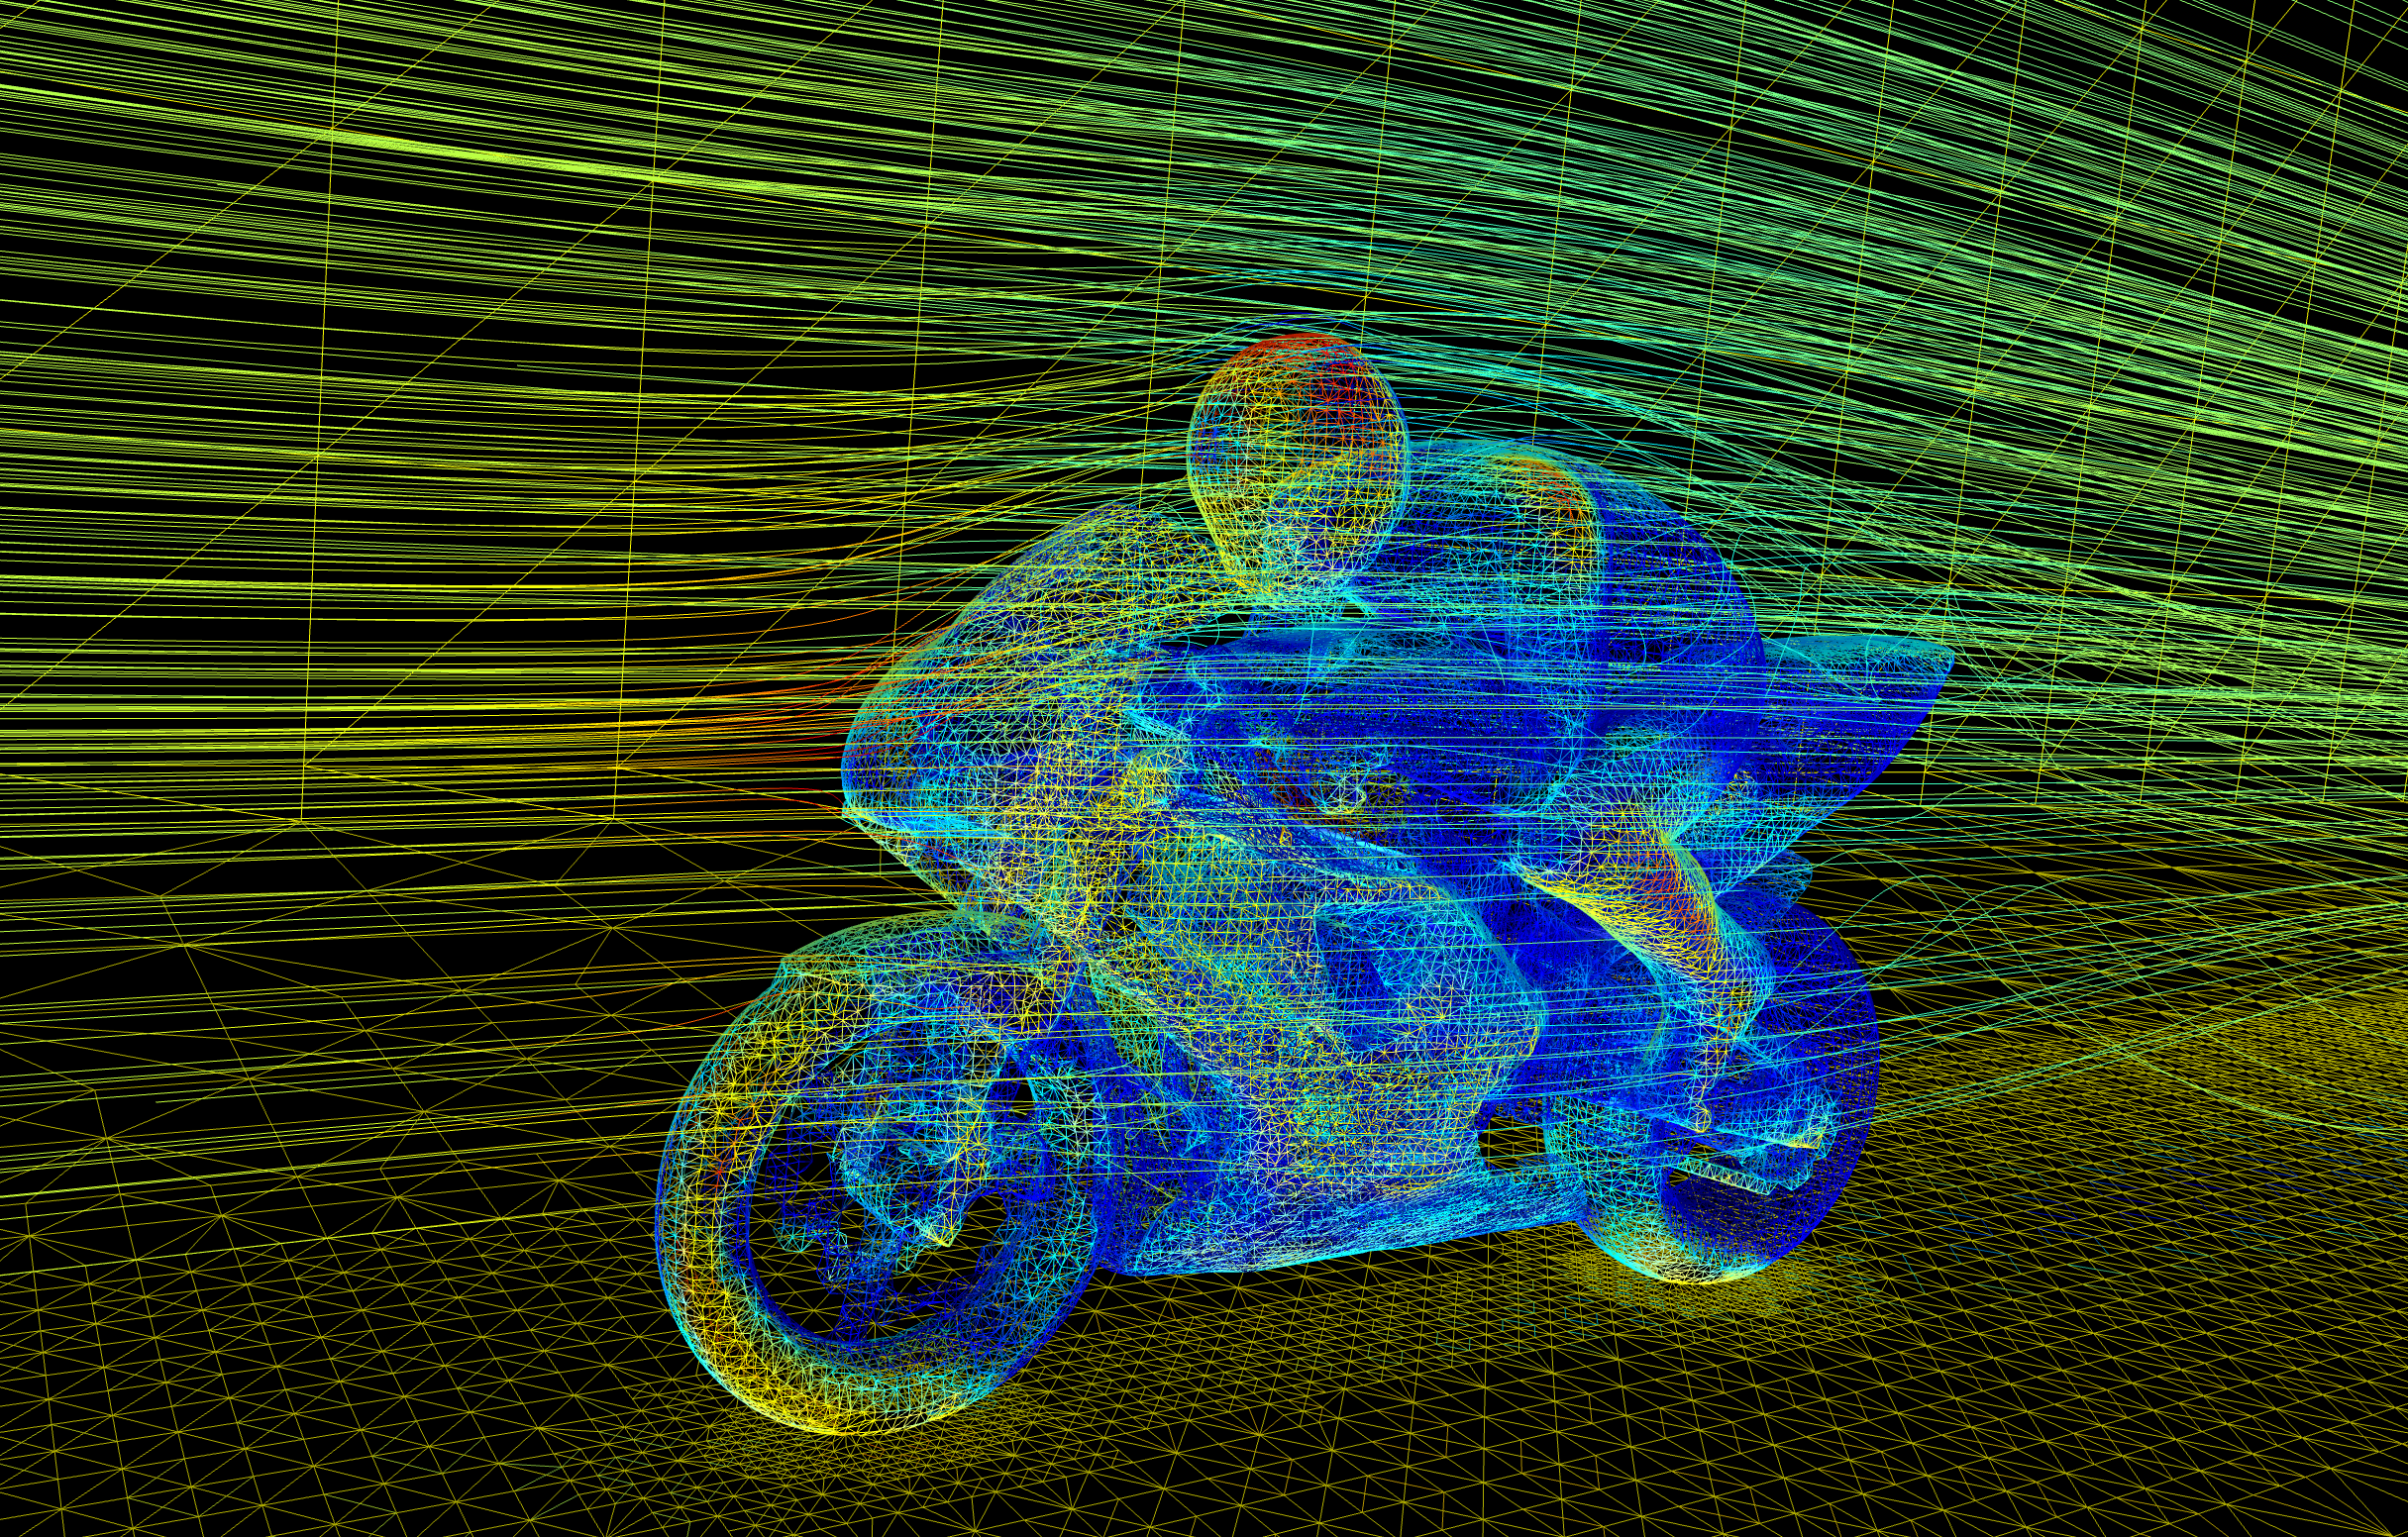
Trace fluid paths through your domain with powerful streamline tools. Choose from lines, tubes, or ribbons, and animate particles to see flow behavior in motion.
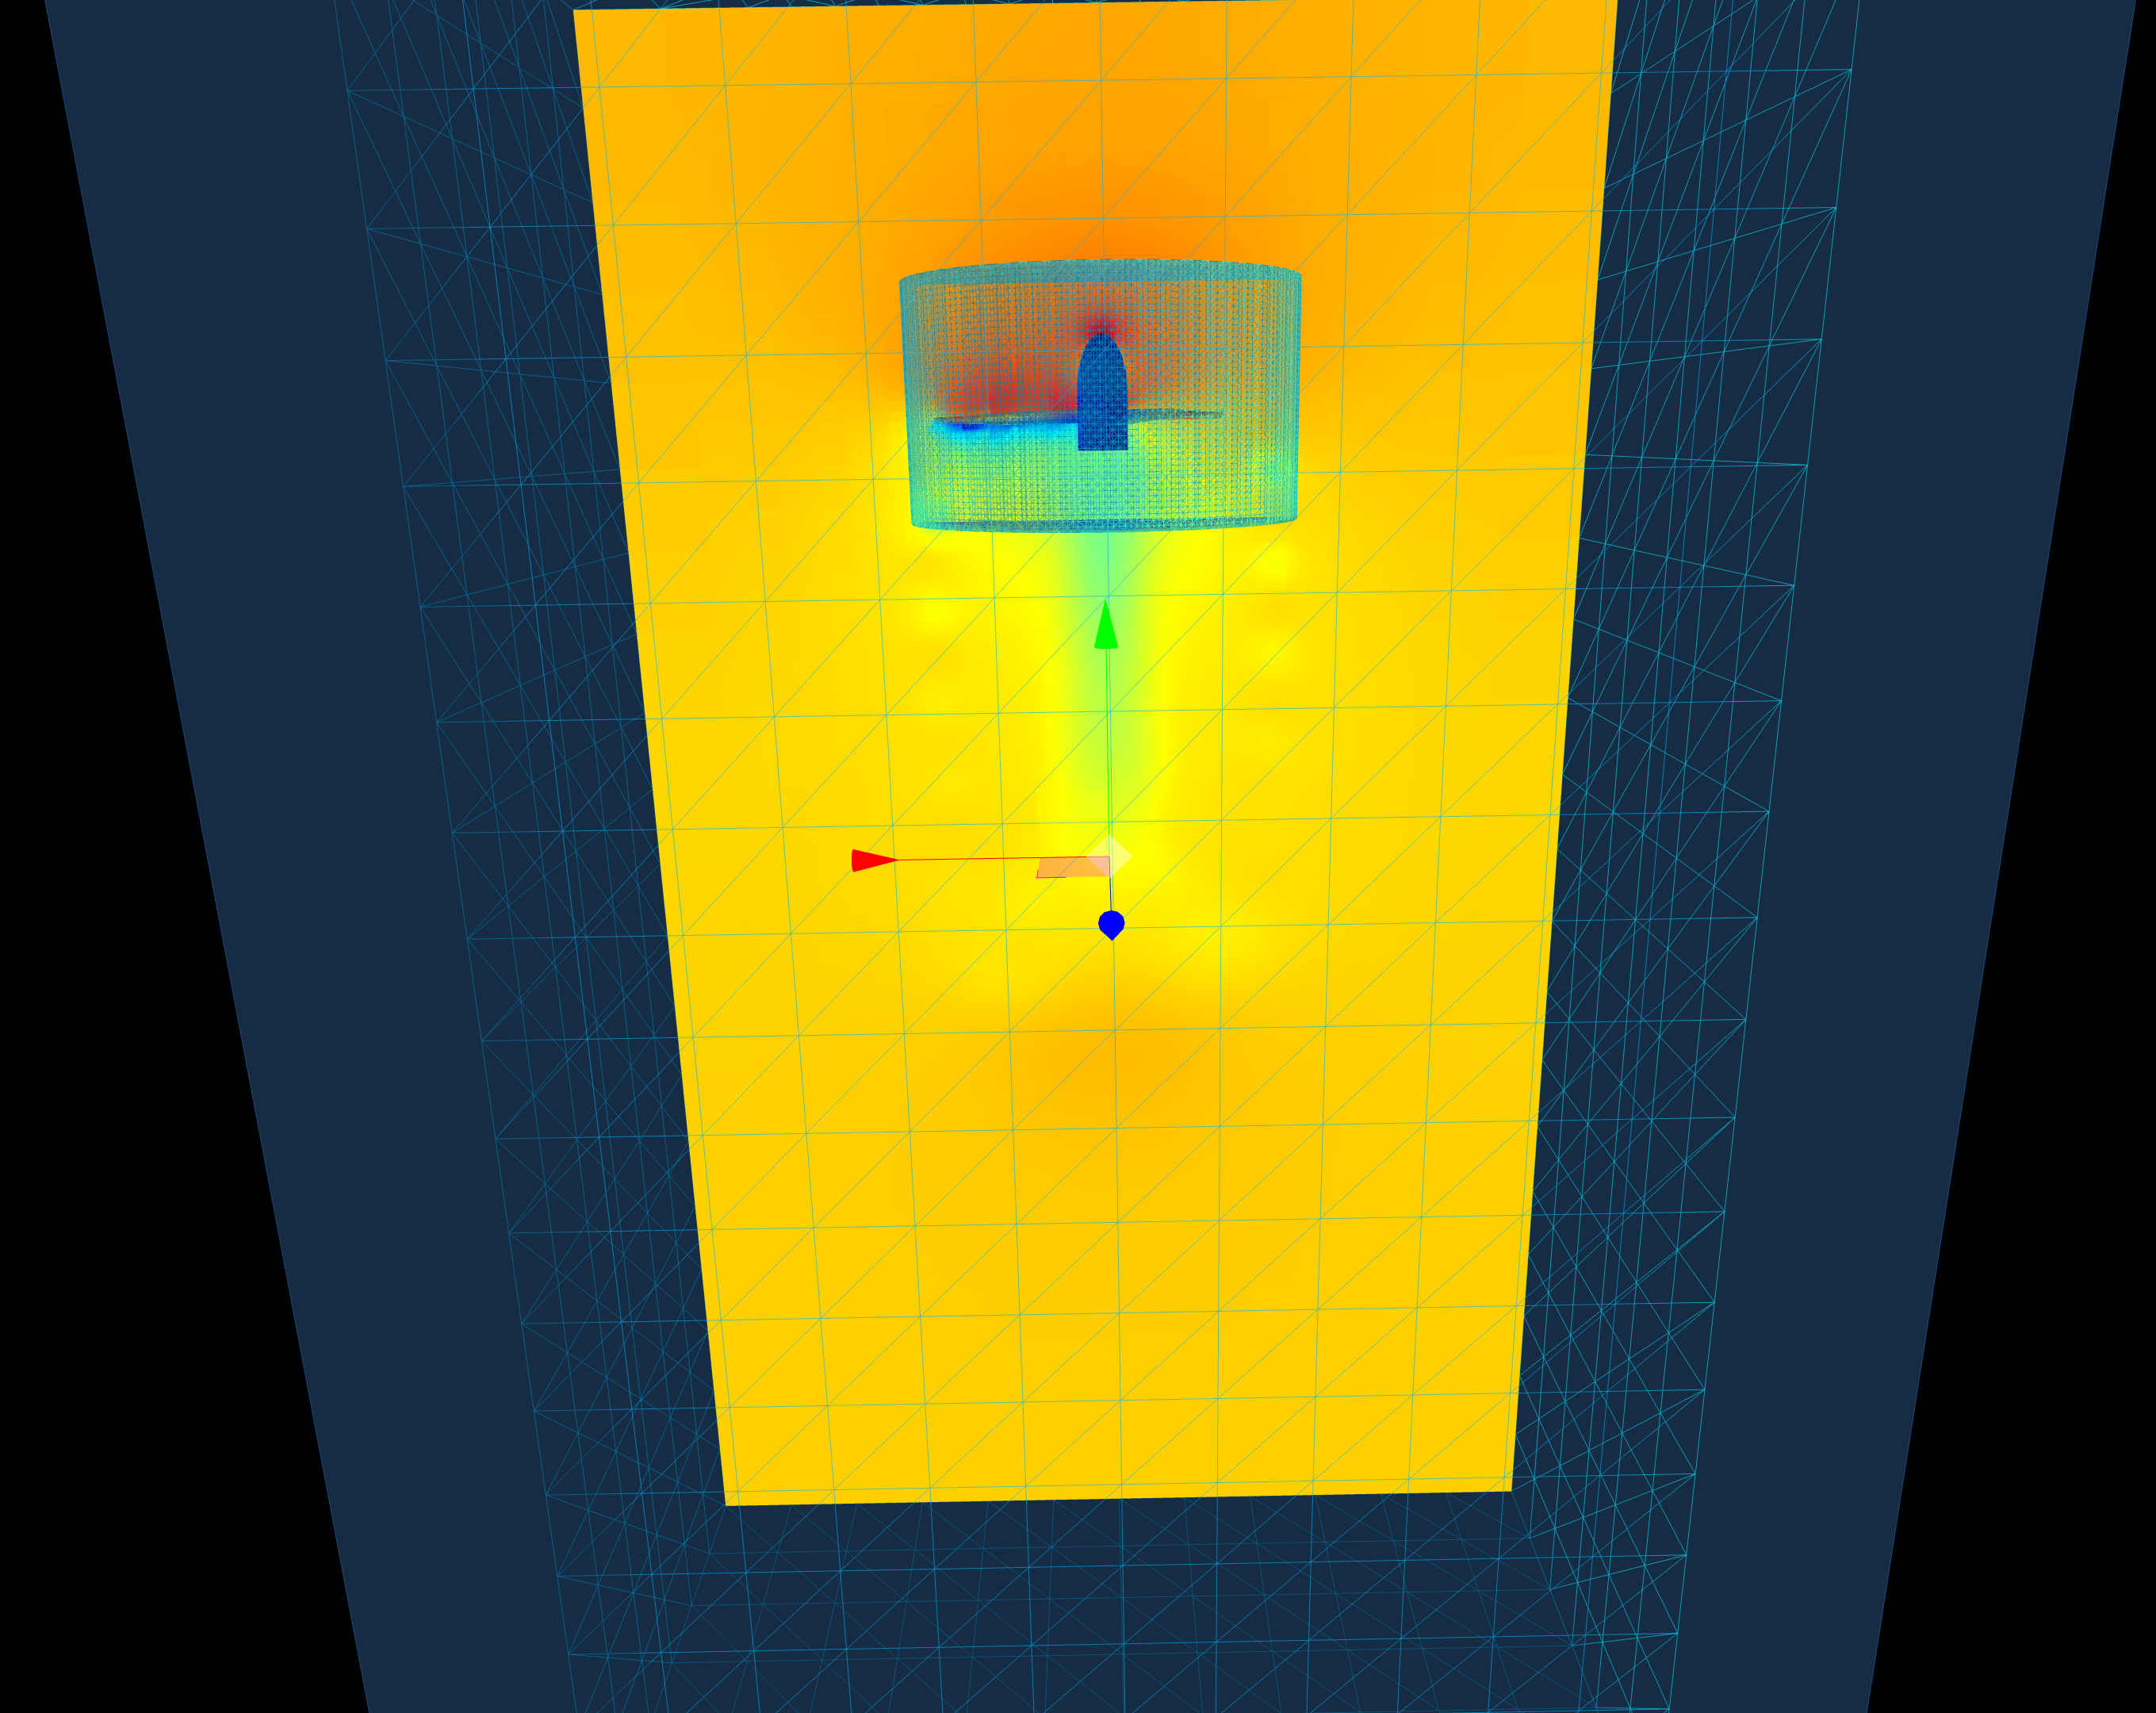
Cut through your mesh with interactive slice planes. Drag to position, rotate to orient, and instantly see scalar fields mapped on the cutting surface.
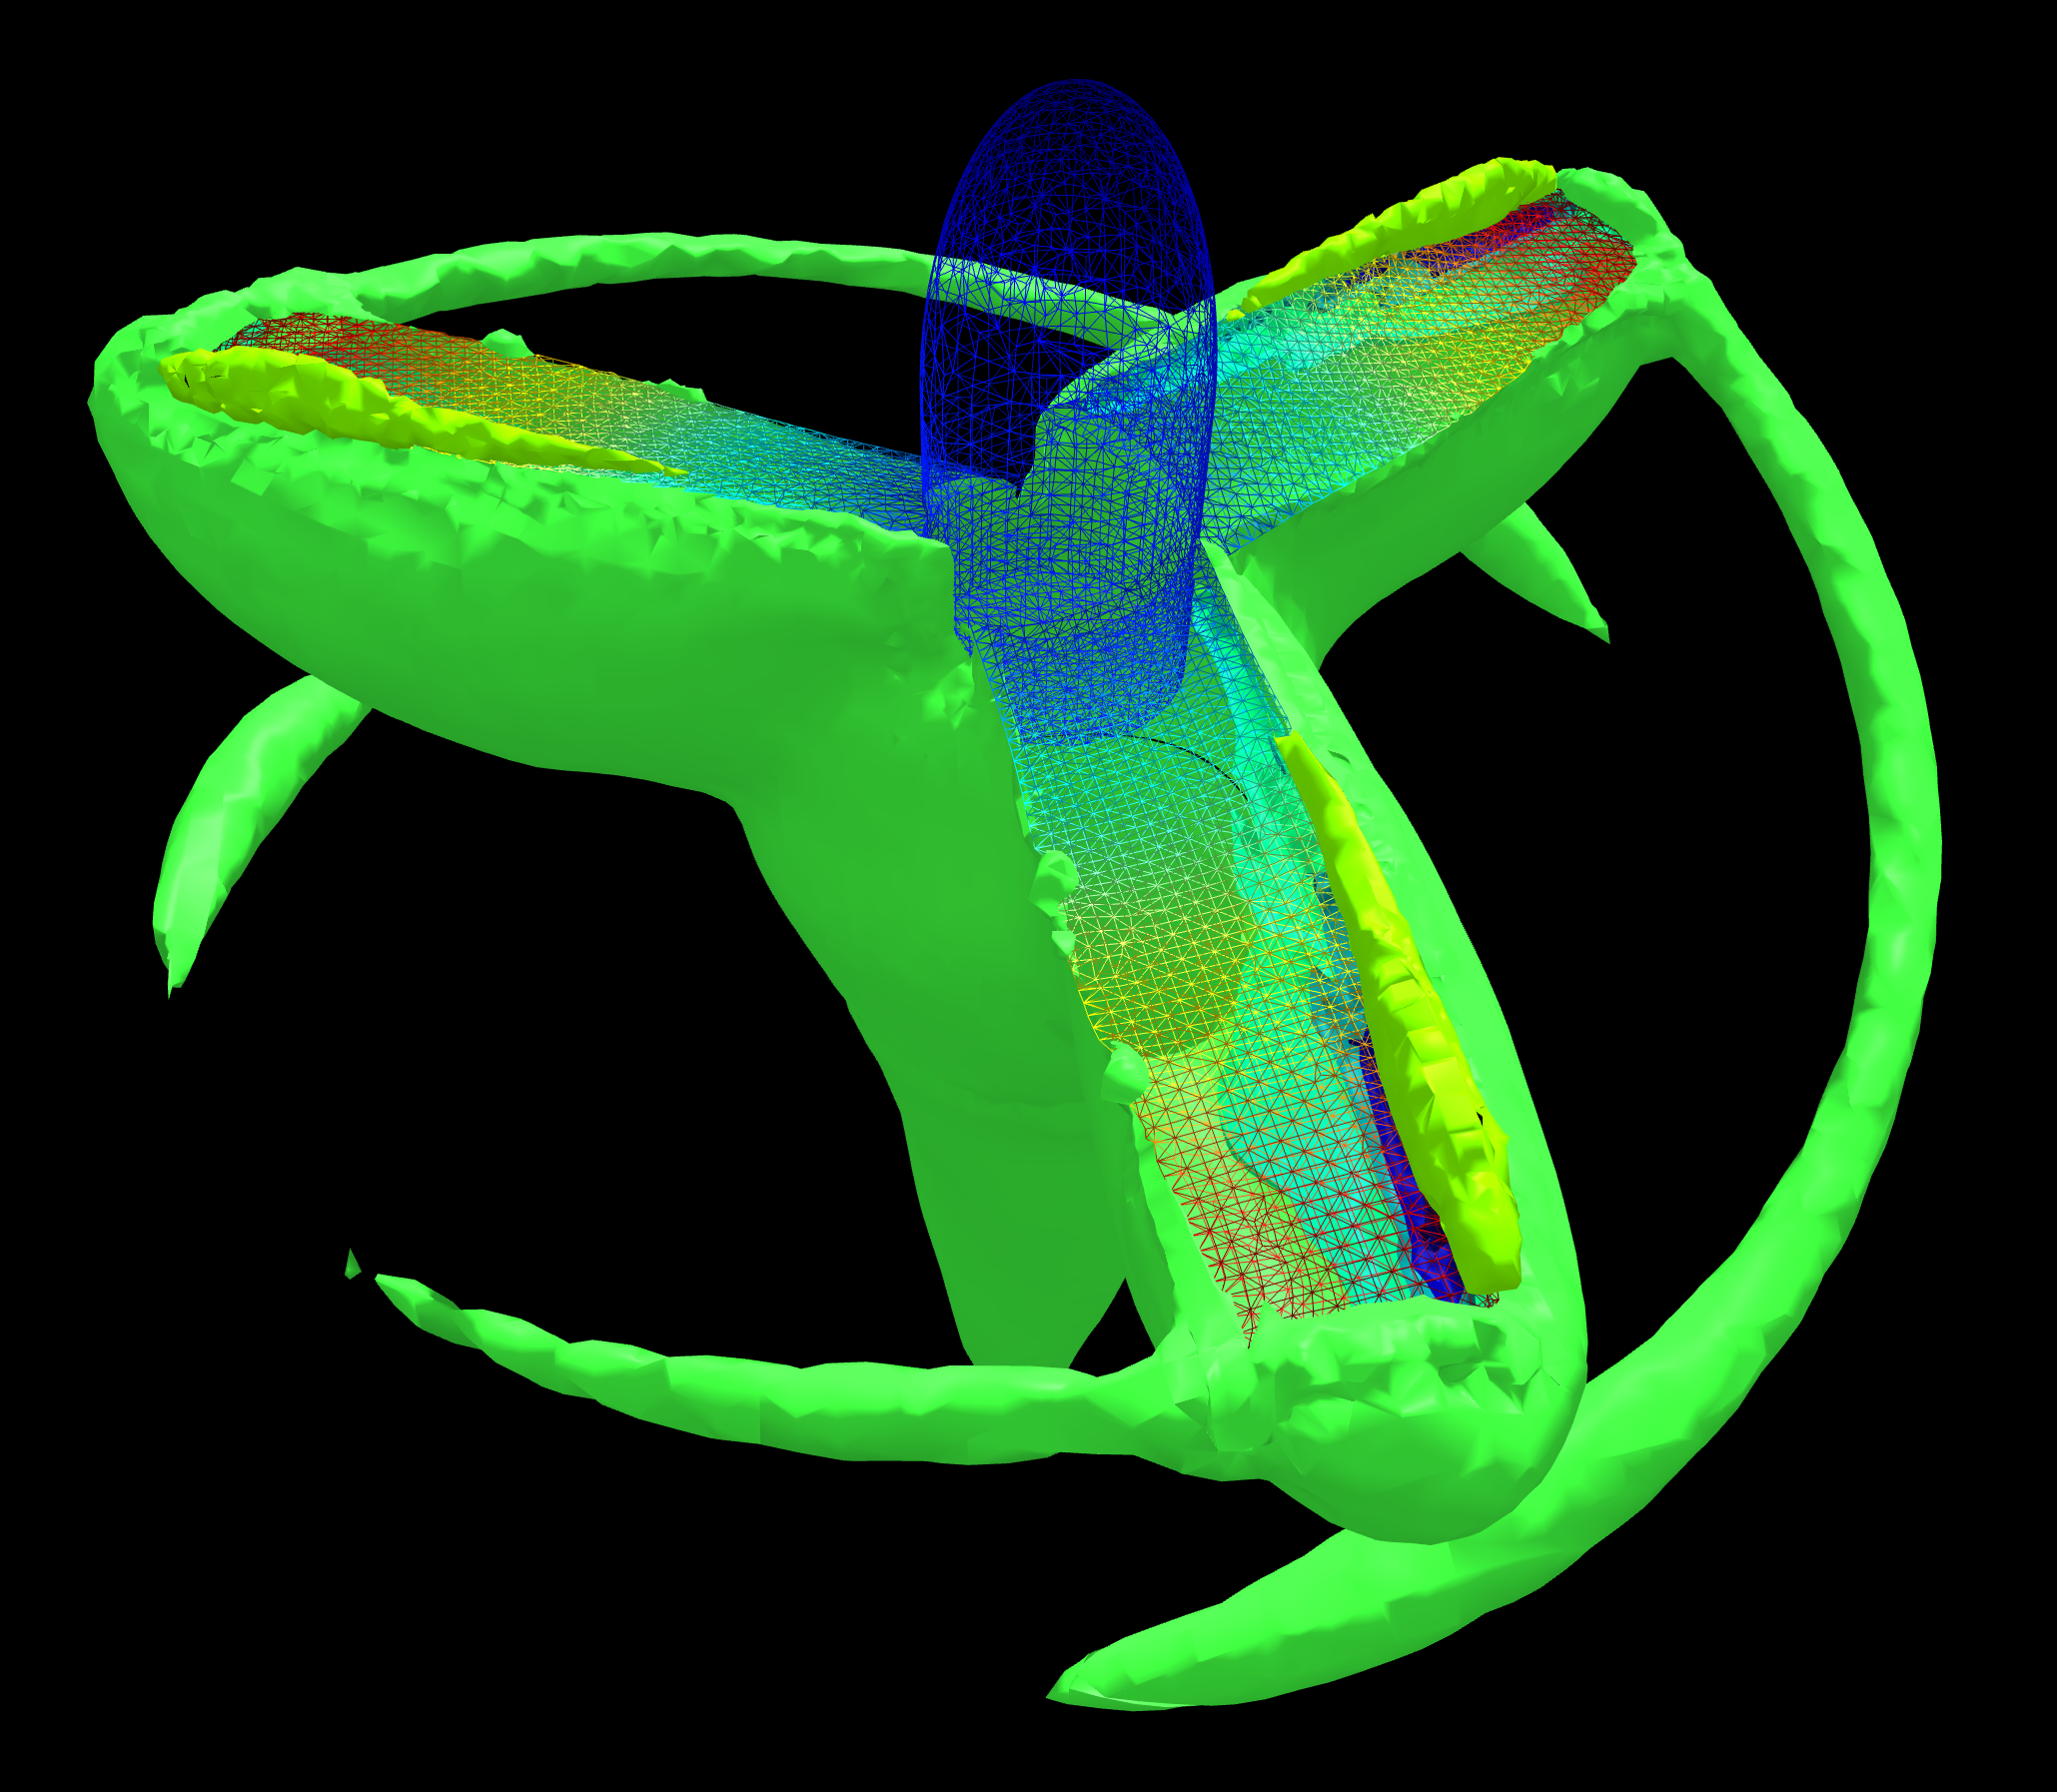
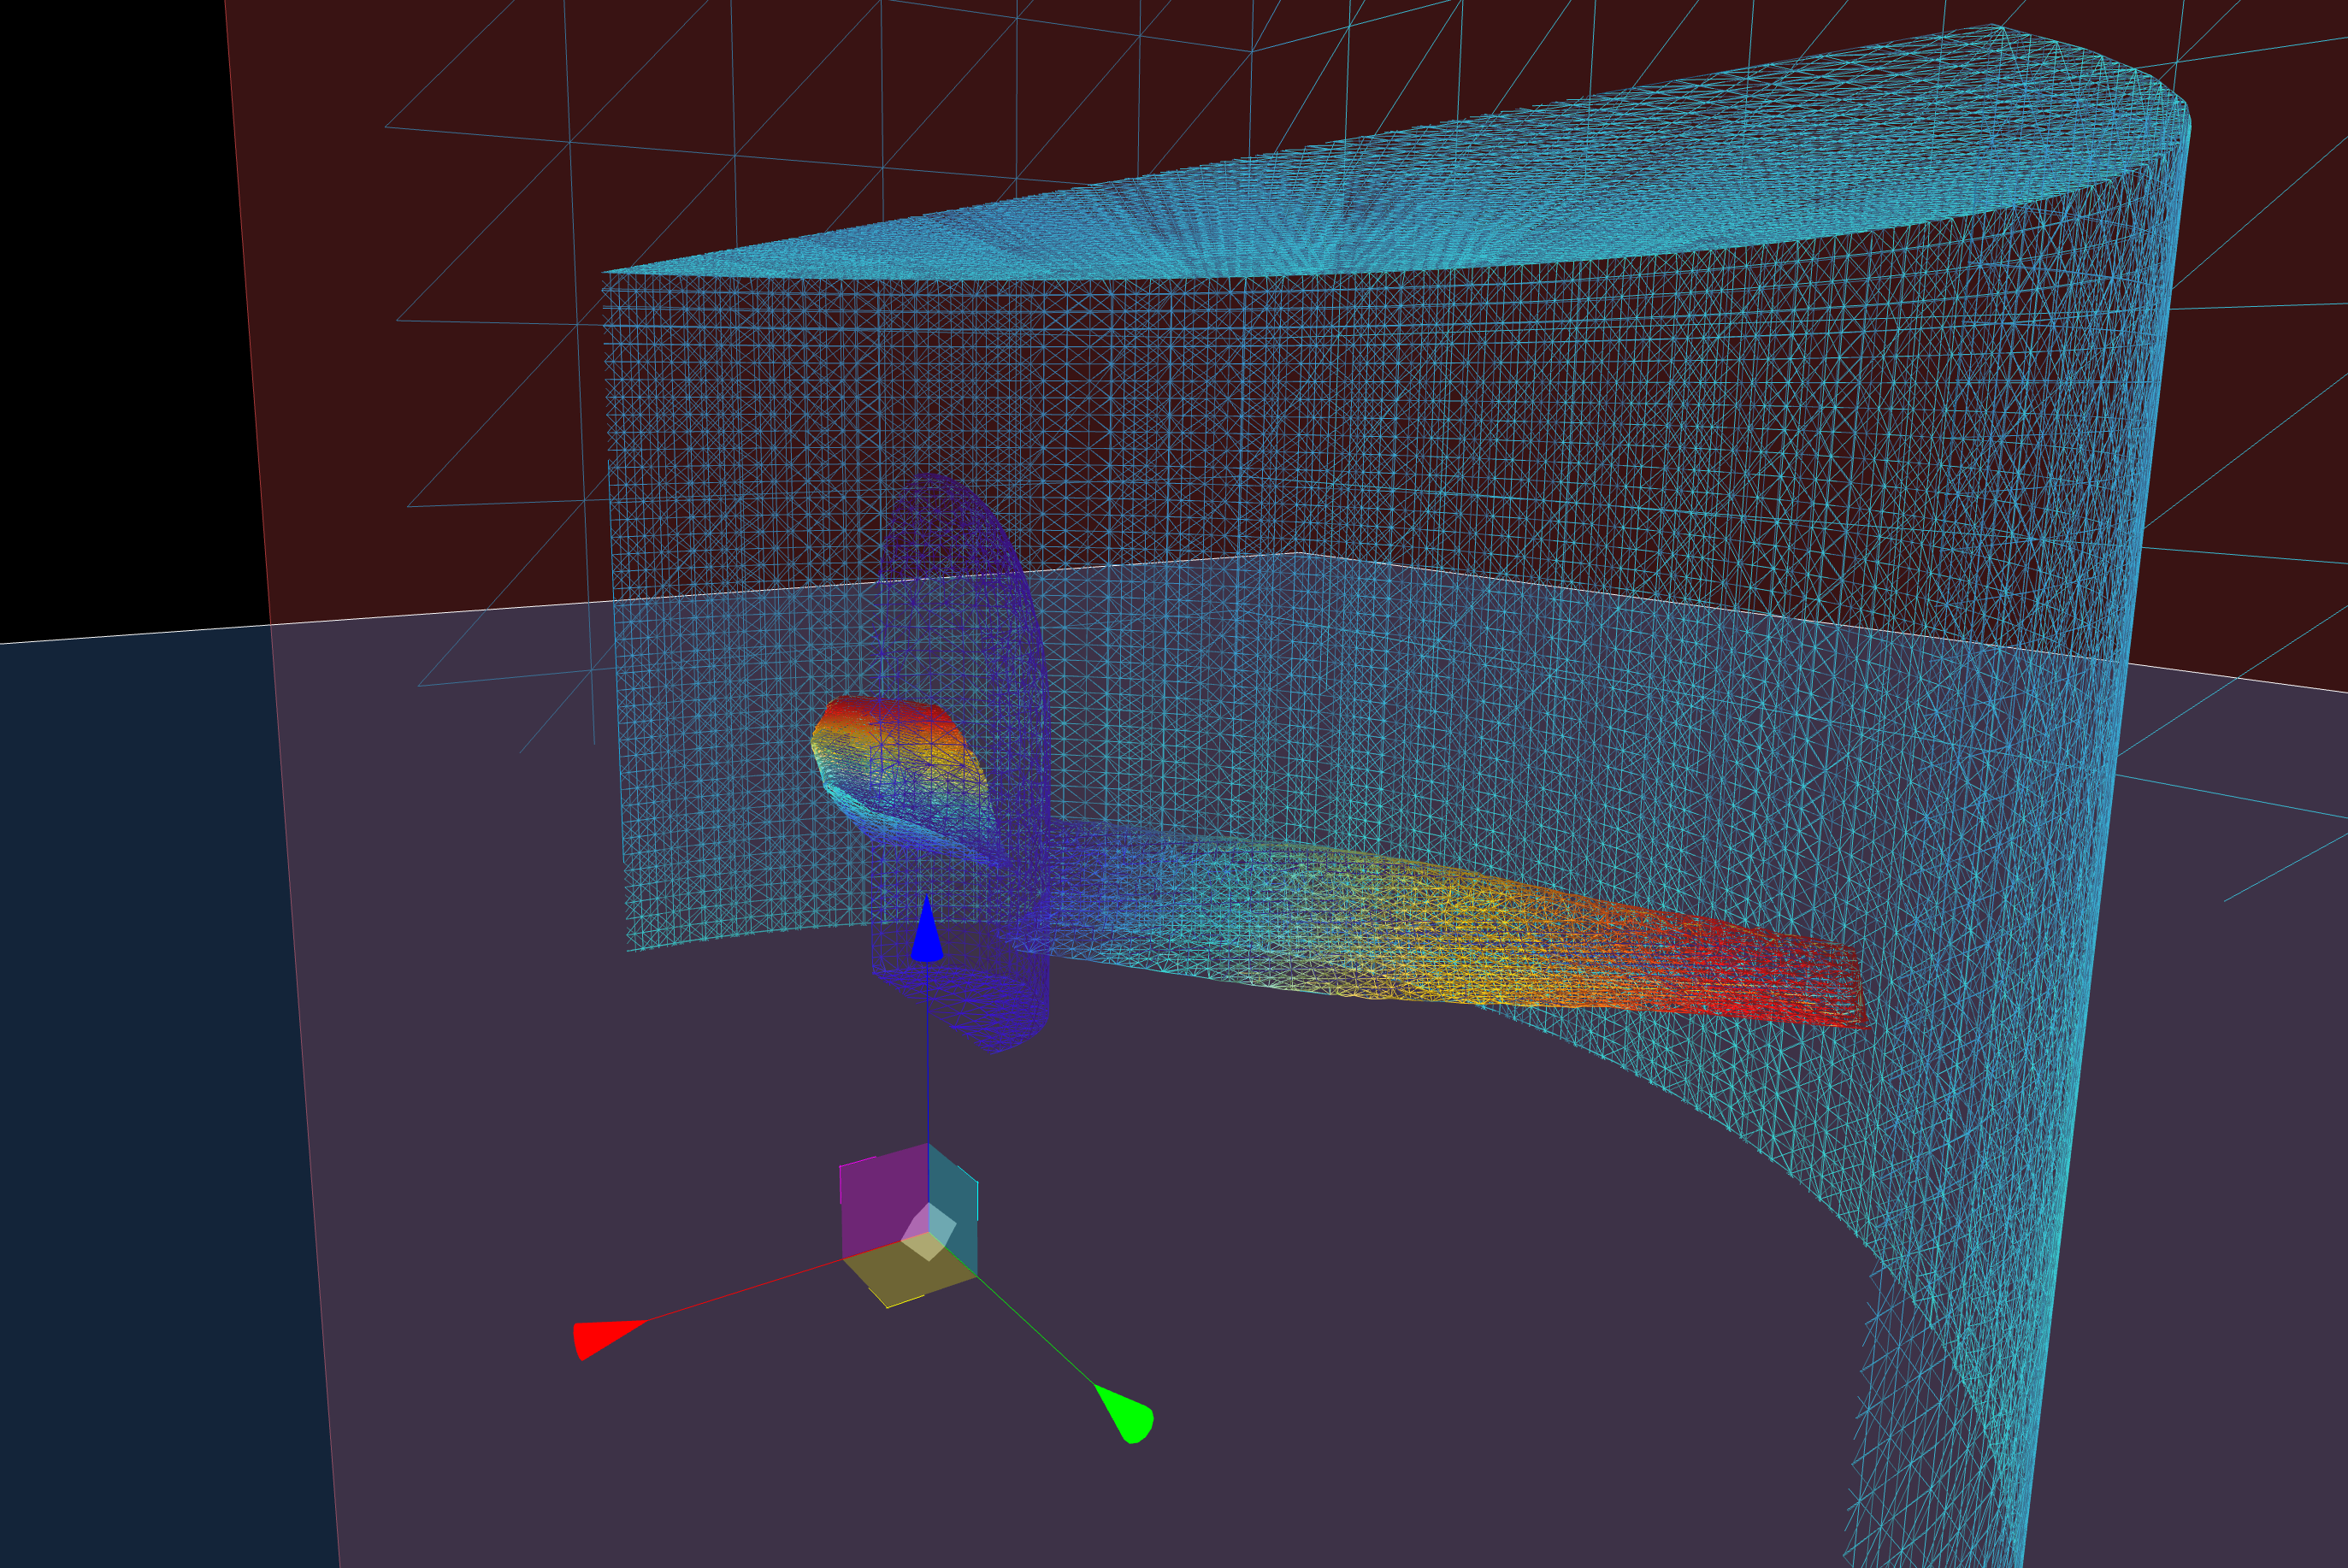
Extract isosurfaces to reveal the 3D structure of your scalar fields. Visualize pressure distributions, temperature gradients, and concentration levels.
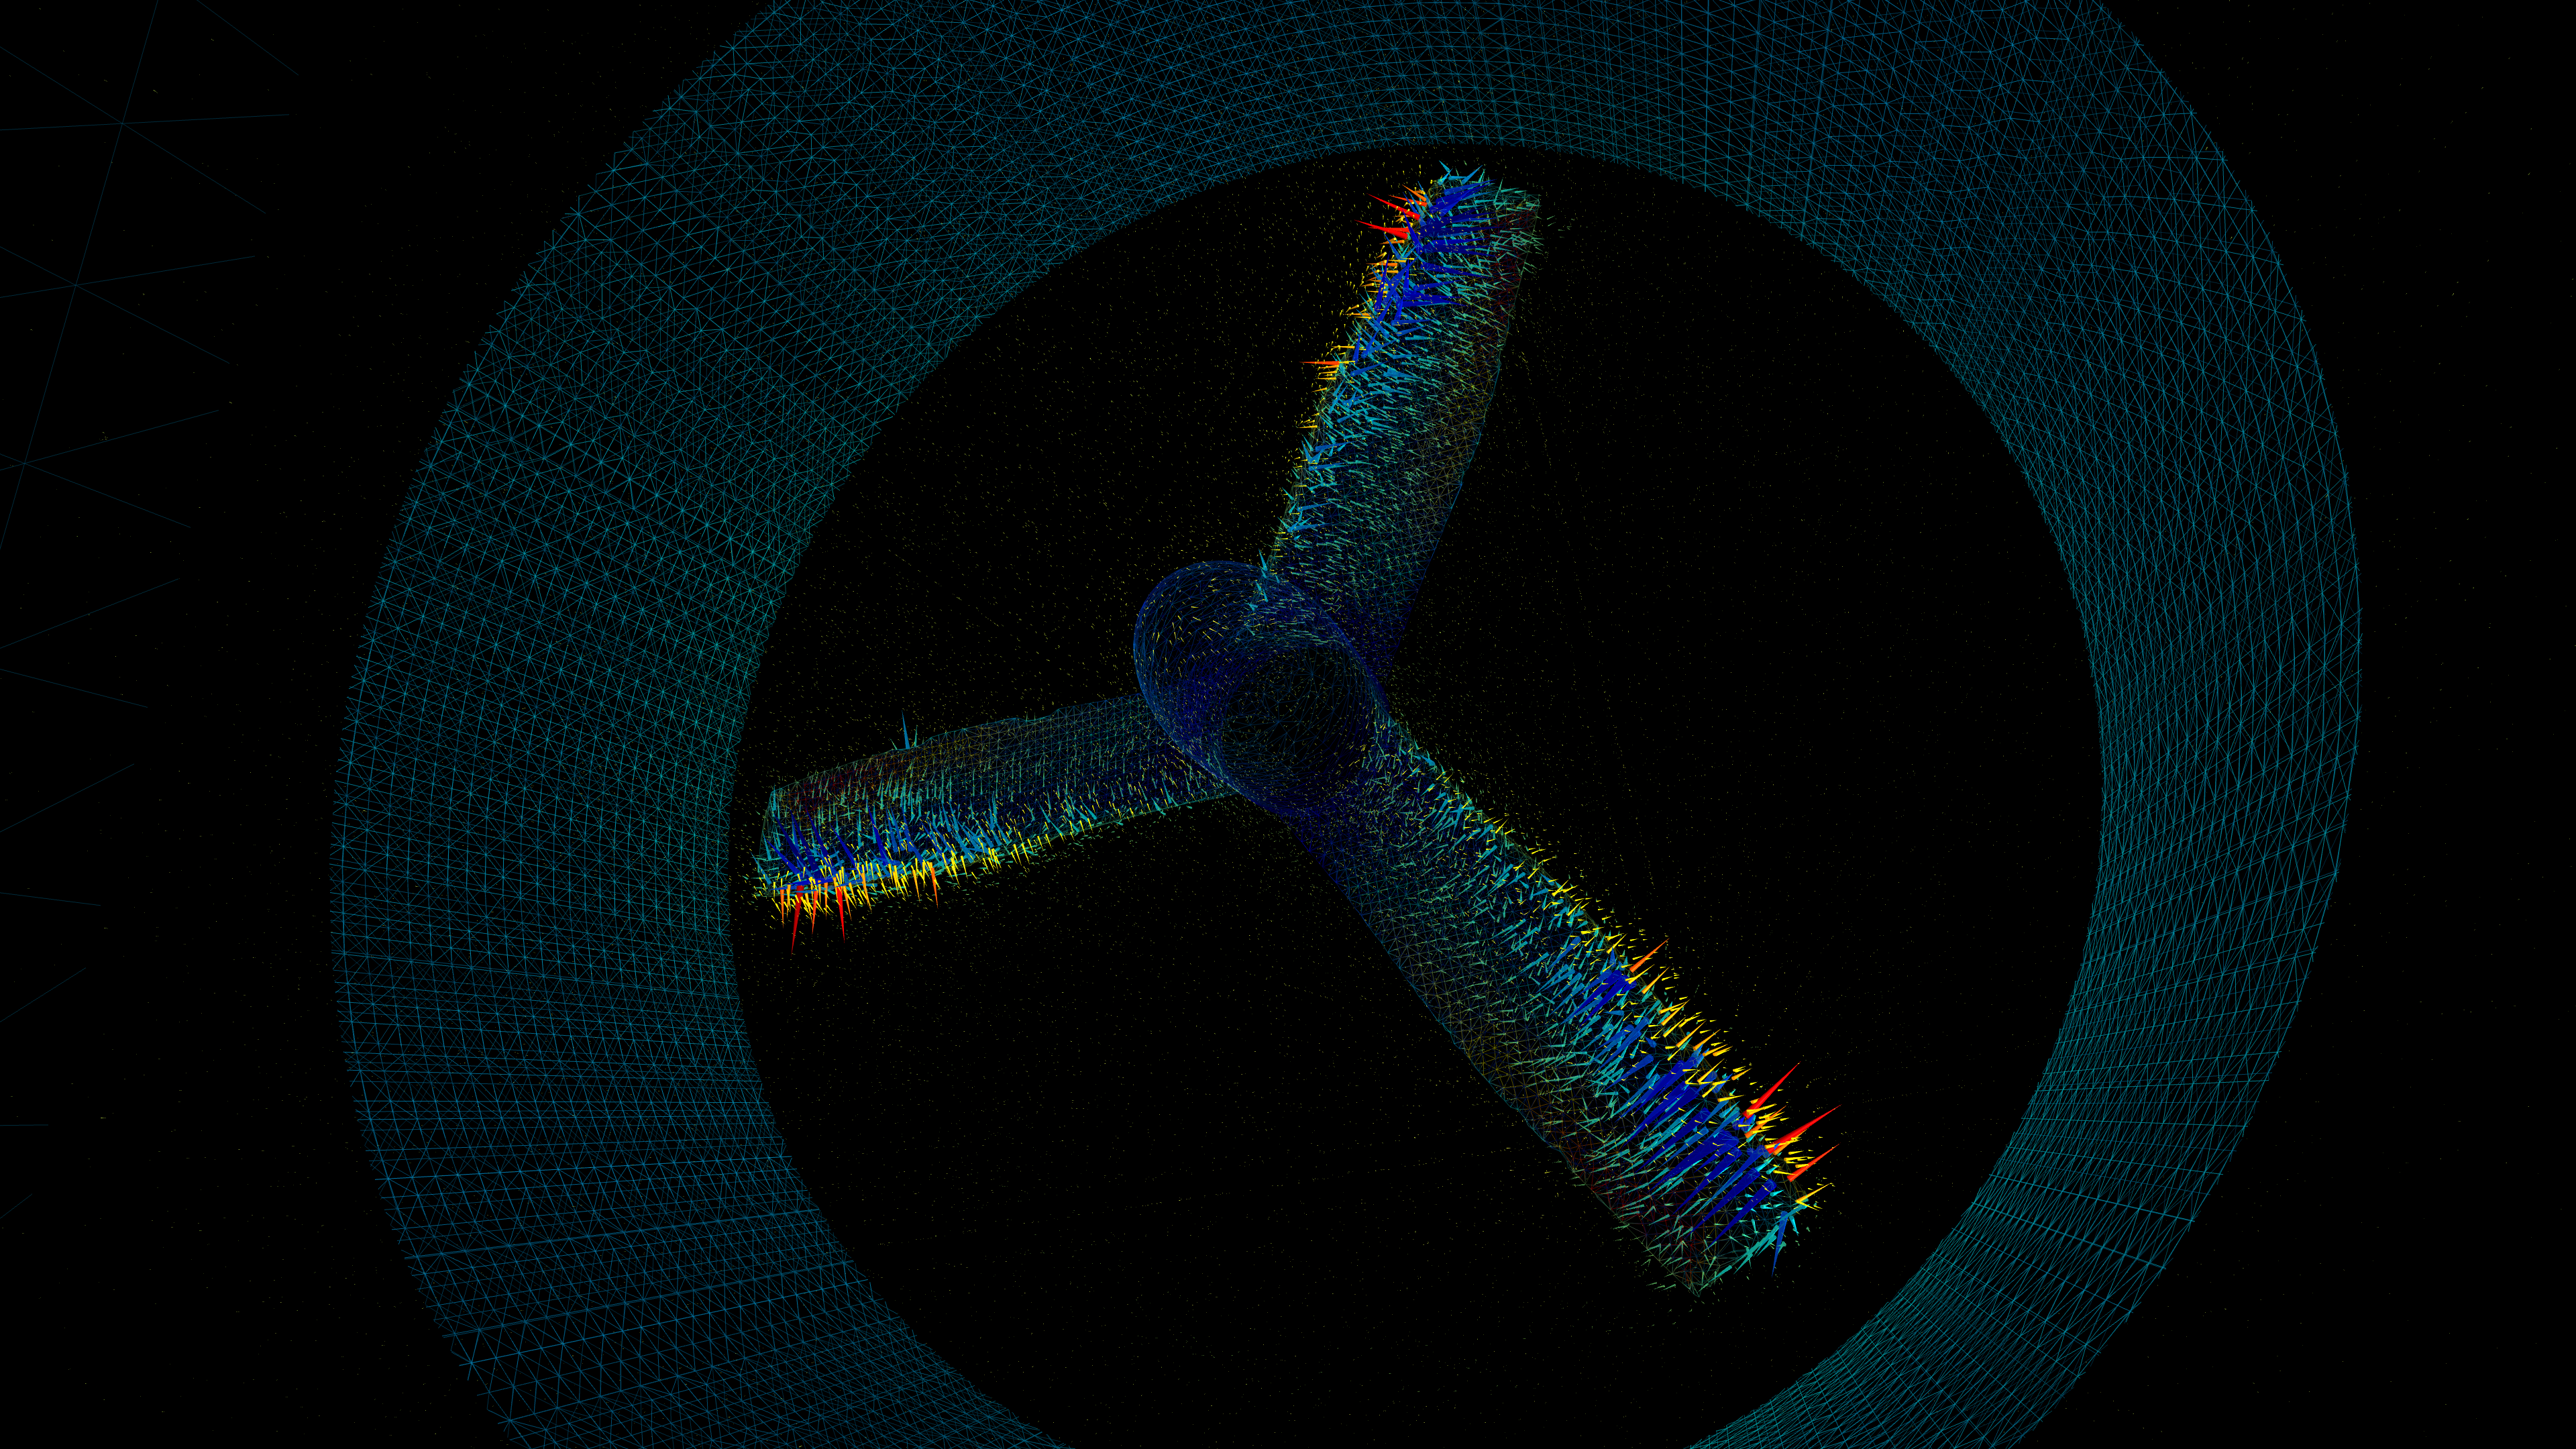
Display velocity and other vector fields with customizable glyphs. Arrows, cones, and spheres show direction and magnitude at a glance.
Create multiple cutting planes to slice through your geometry and reveal internal flow structures. Each plane can be independently positioned, rotated, and sized with bounded slab extraction.
Work together with your team on the same simulation. See collaborator presence, take control of sessions for guided walkthroughs, and communicate via integrated voice calls.
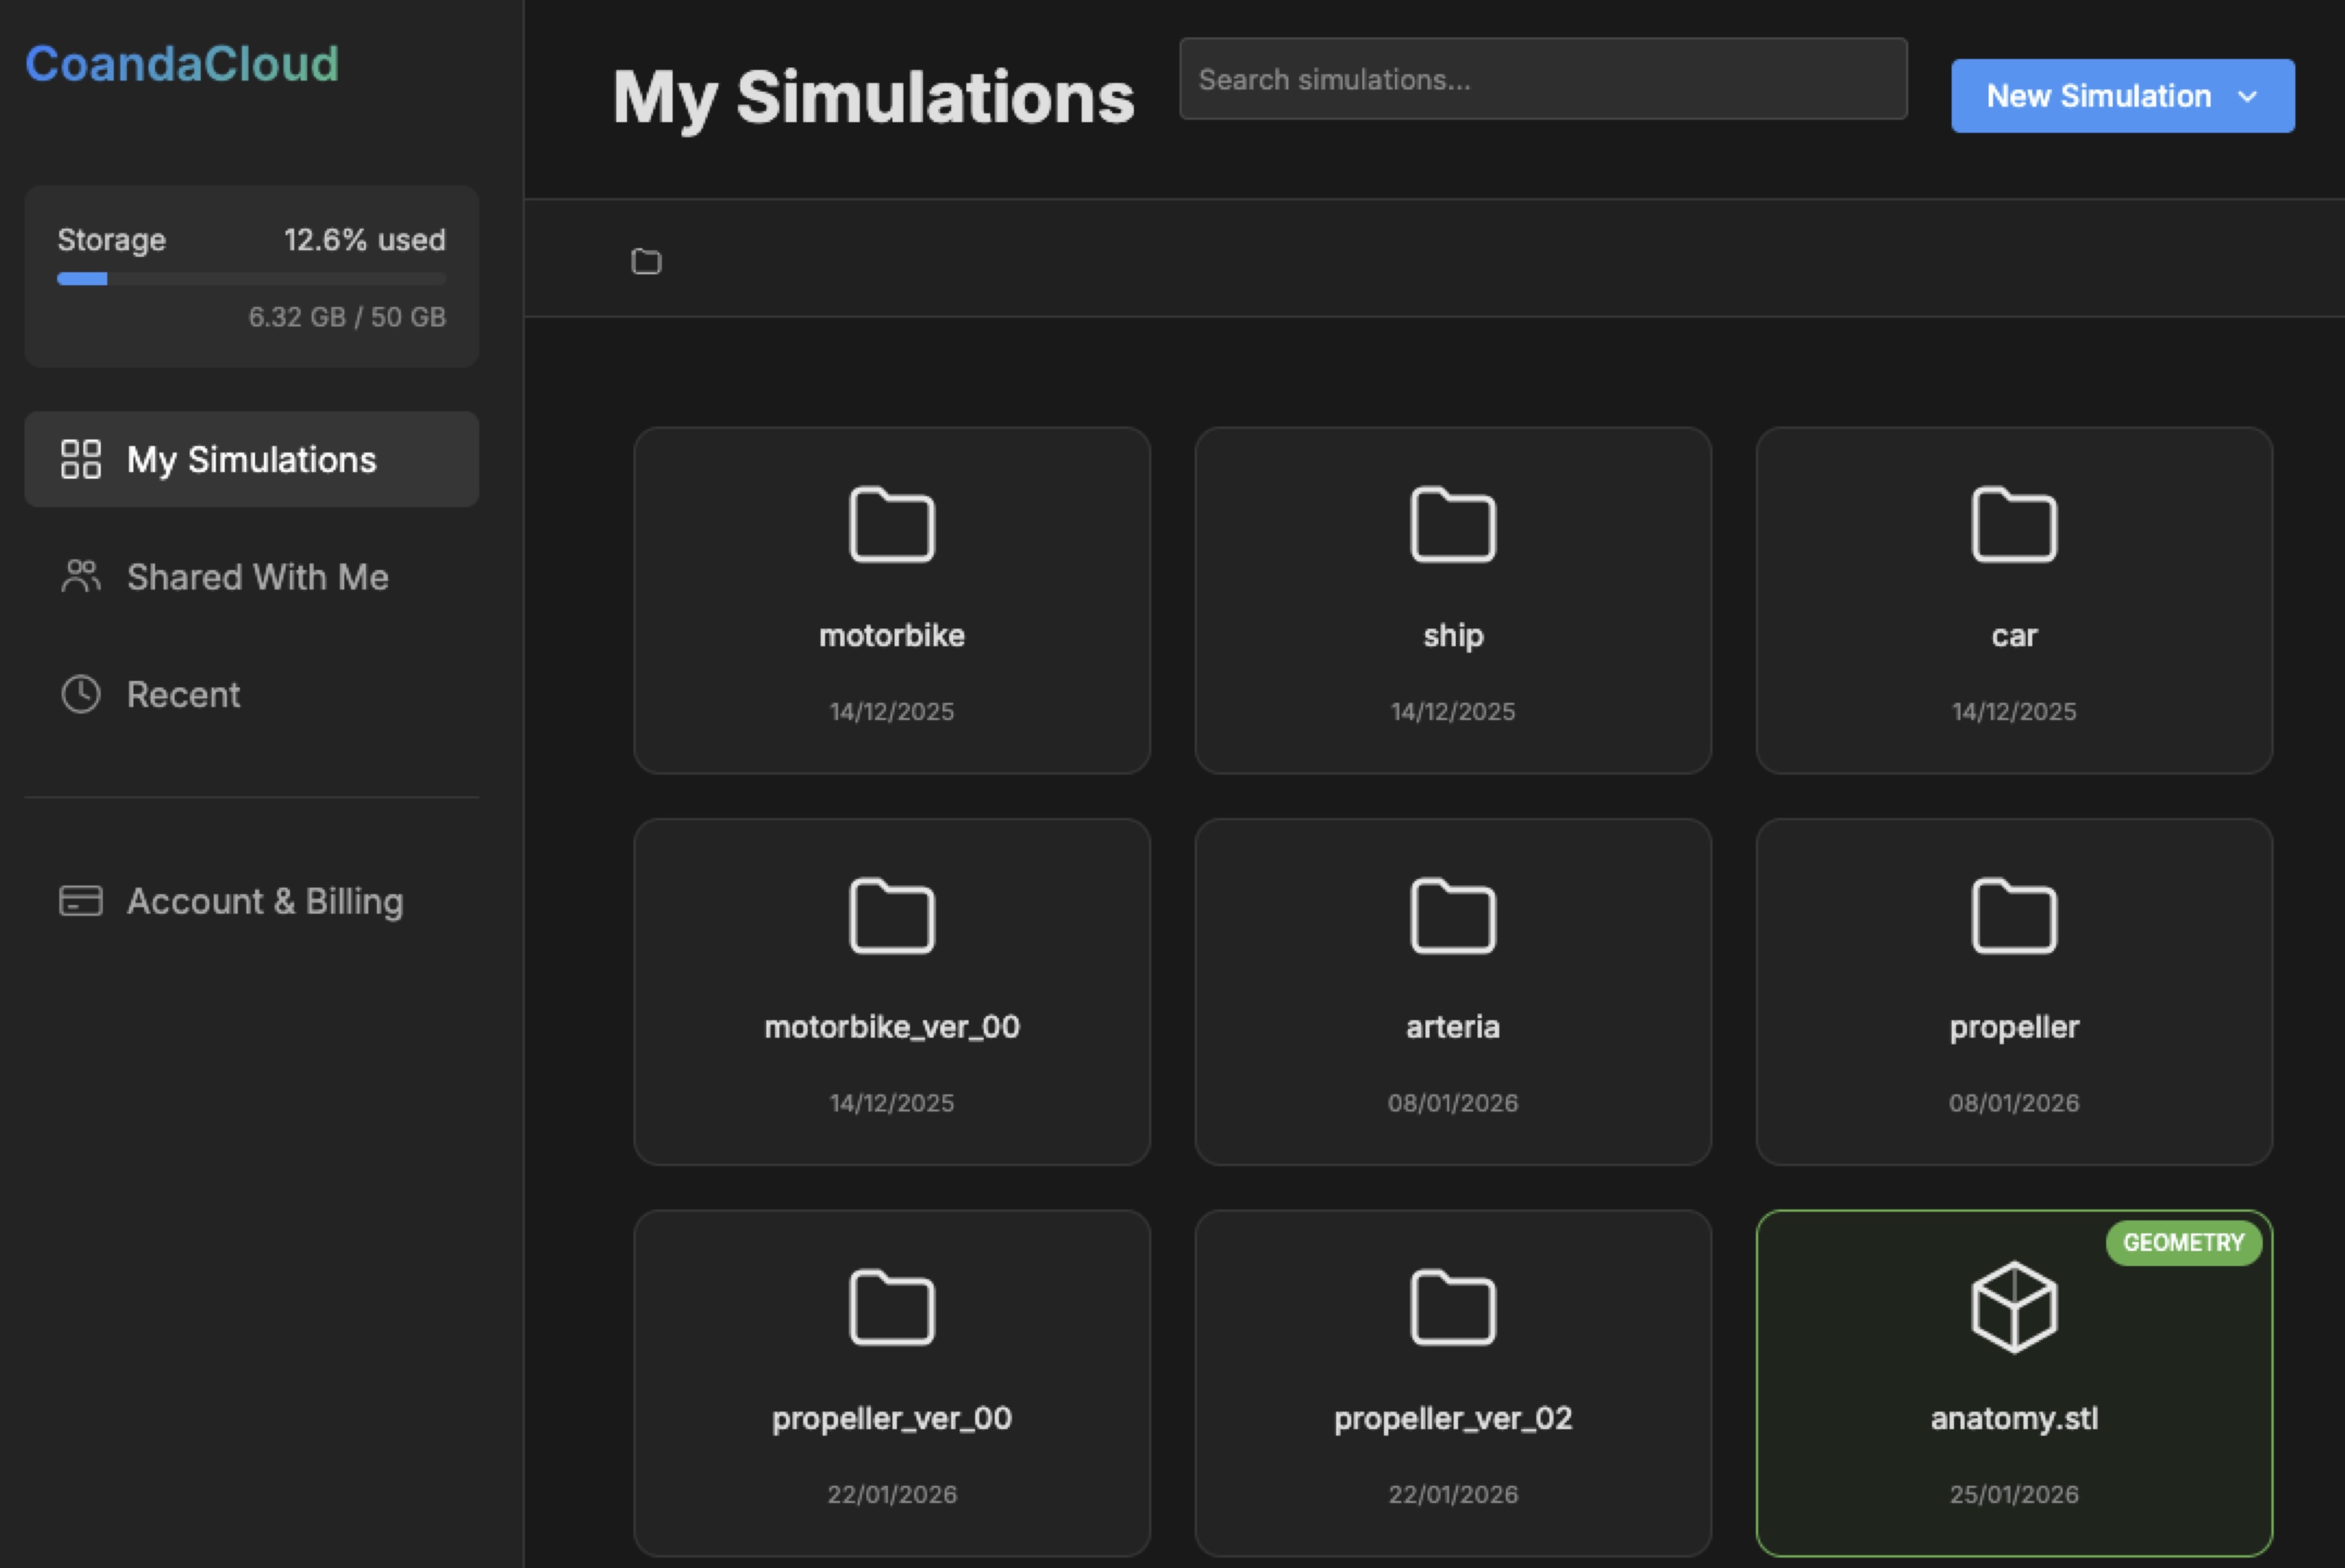
Upload your simulations to secure cloud storage. Organize your projects, share with collaborators, and access your data from any device, anywhere.
Start free, upgrade as your needs grow
Built for engineers, researchers, and scientists
CoandaCloud is a modern, browser-based scientific visualization platform designed to make analyzing CFD and simulation data easier than ever. Whether you're working with OpenFOAM cases, 3D meshes, or custom datasets, CoandaCloud provides professional-grade visualization without the need for complex installations.
Built with modern web technologies, CoandaCloud brings powerful visualization tools directly to your browser, making it perfect for remote work, collaboration, and quick analysis.
Have a question, feature request, or feedback? We'd love to hear from you.